Heat Emergency ————— a geoinformation ML system devoted to modeling of emergencies at heat supply facilities.
Every day the city accumulates data on the emergencies that have occurred at heat supply facilities - residential buildings and heating points. A huge array of such data, combined with data on the characteristics of heat supply facilities and weather conditions, allows you to create new emergency management tools.
HeatEmergency is an application for the city that helps not only improve control to prevent emergencies, but also build the best response scenario to an accident that has already occurred
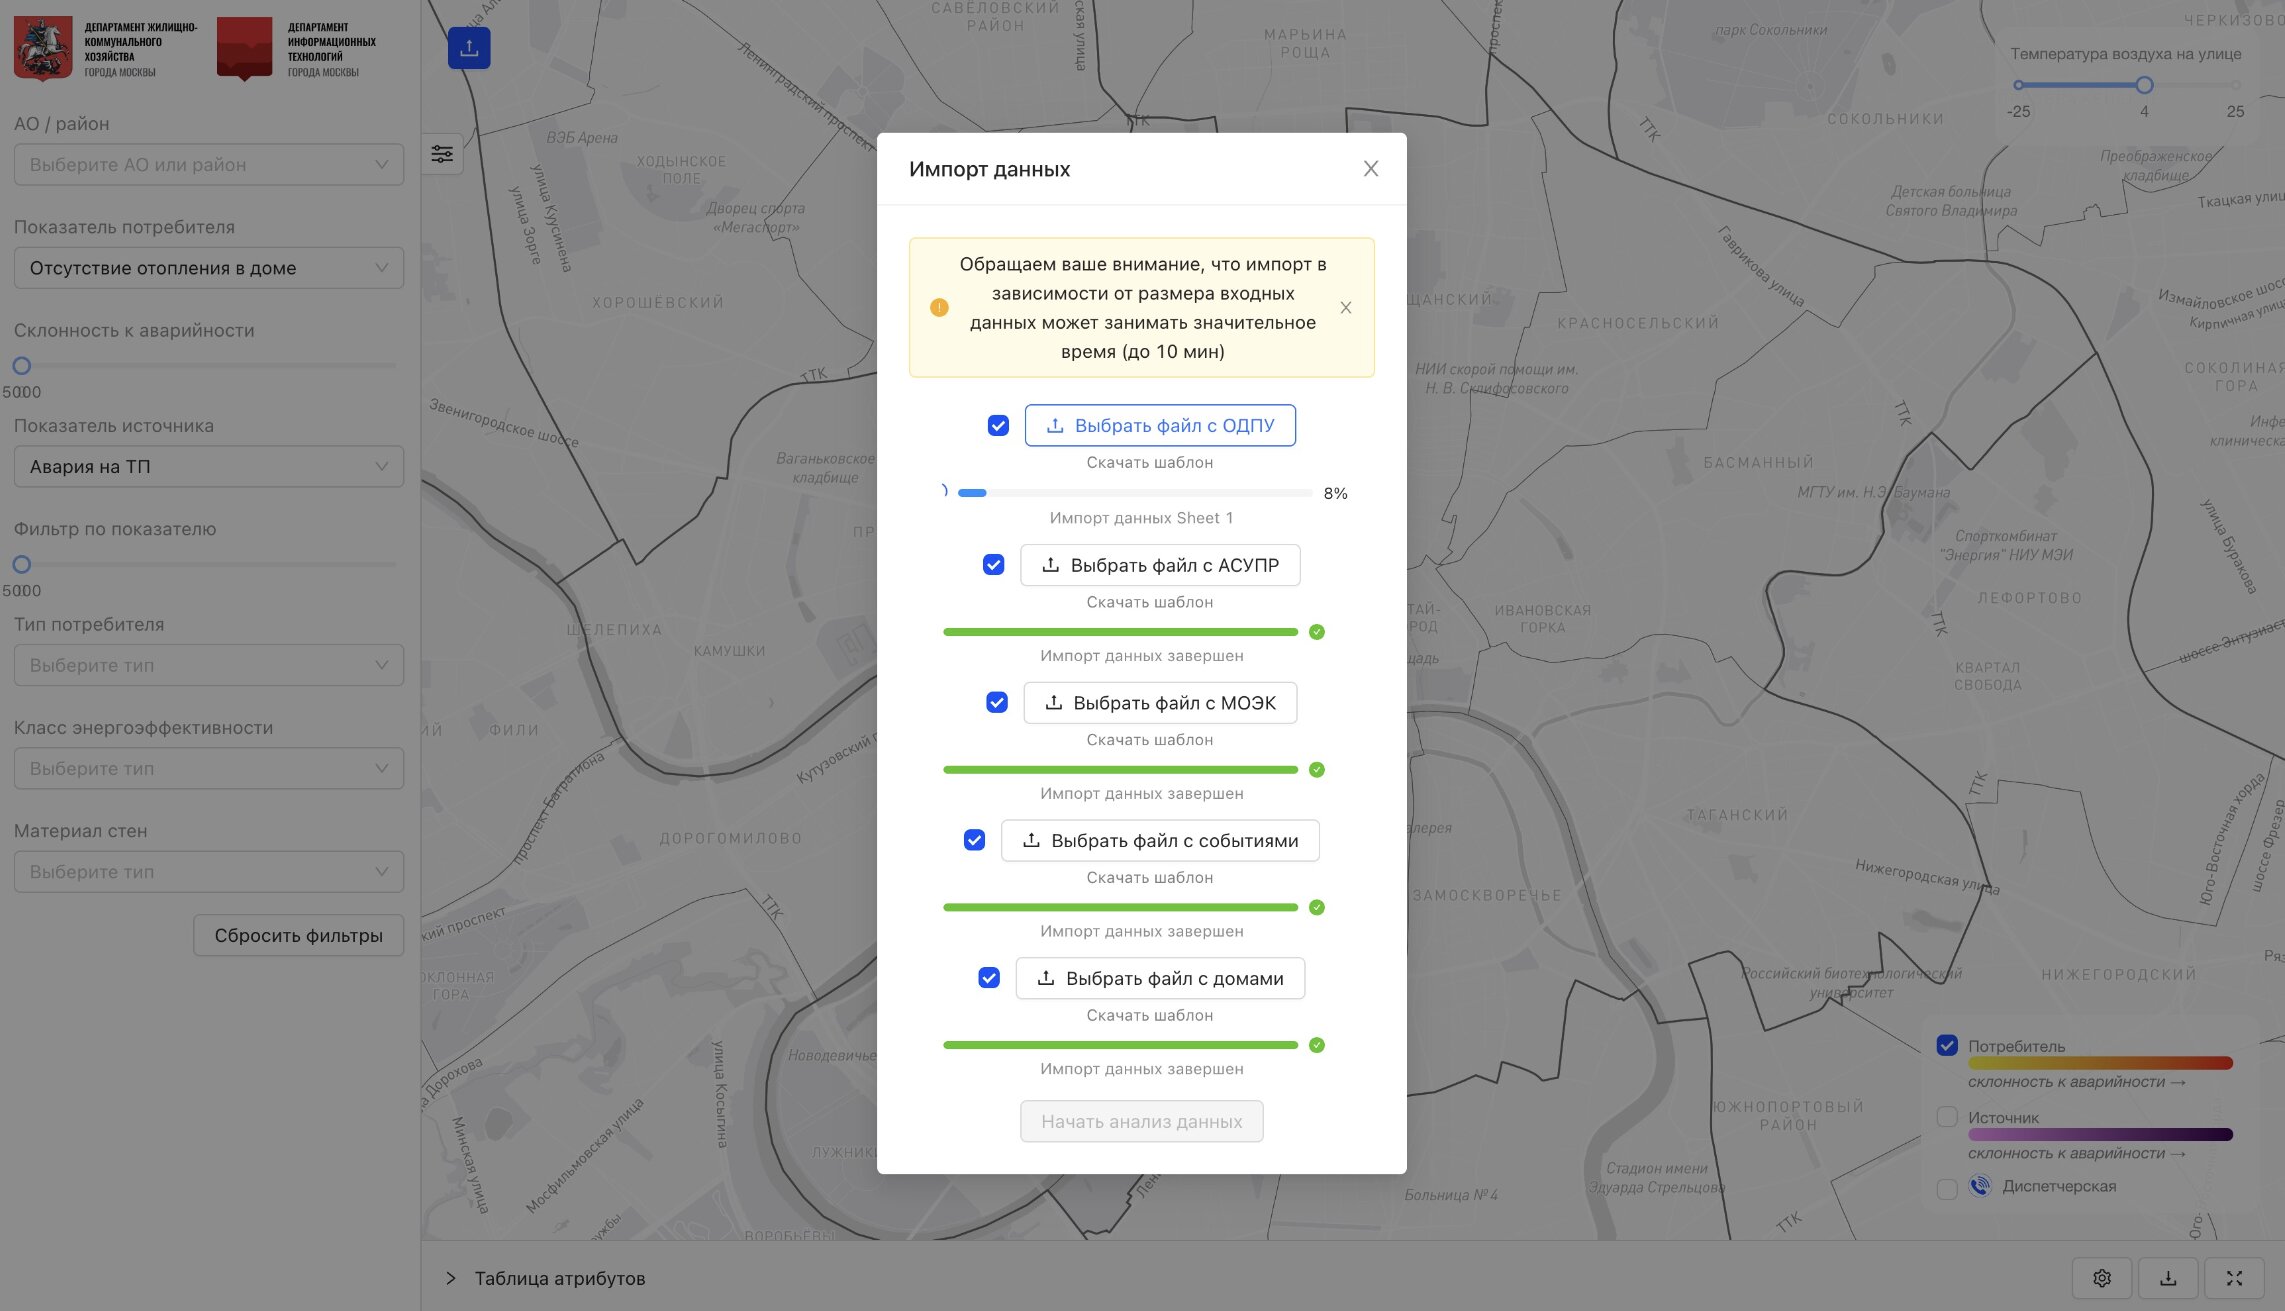
Before using, it is necessary to import all the necessary data into the system — locations of residential buildings and infrastructure facilities, communication of heat supply facilities with each other, emergency situations of different types that have occurred in residential buildings, indicators of general house metering devices
In case of industrial use of the system, all data should be imported in advance, and data requiring frequent updates (emergency situations and indicators of general house metering devices) should be transmitted to the system automatically through integrations with the corresponding information systems of housing and communal services.
After importing the emergency situations data into the system, a training set is formed, consisting of the emergencies of a certain type in certain residential buildings on specific dates and the data of the absence of such accidents.
Besides, many signs are formed for the model, including the type of walls, year of construction, number of storeys, data on the overhaul of various parts of the water supply system of residential buildings, etc. (about 50 signs in total), weather conditions.
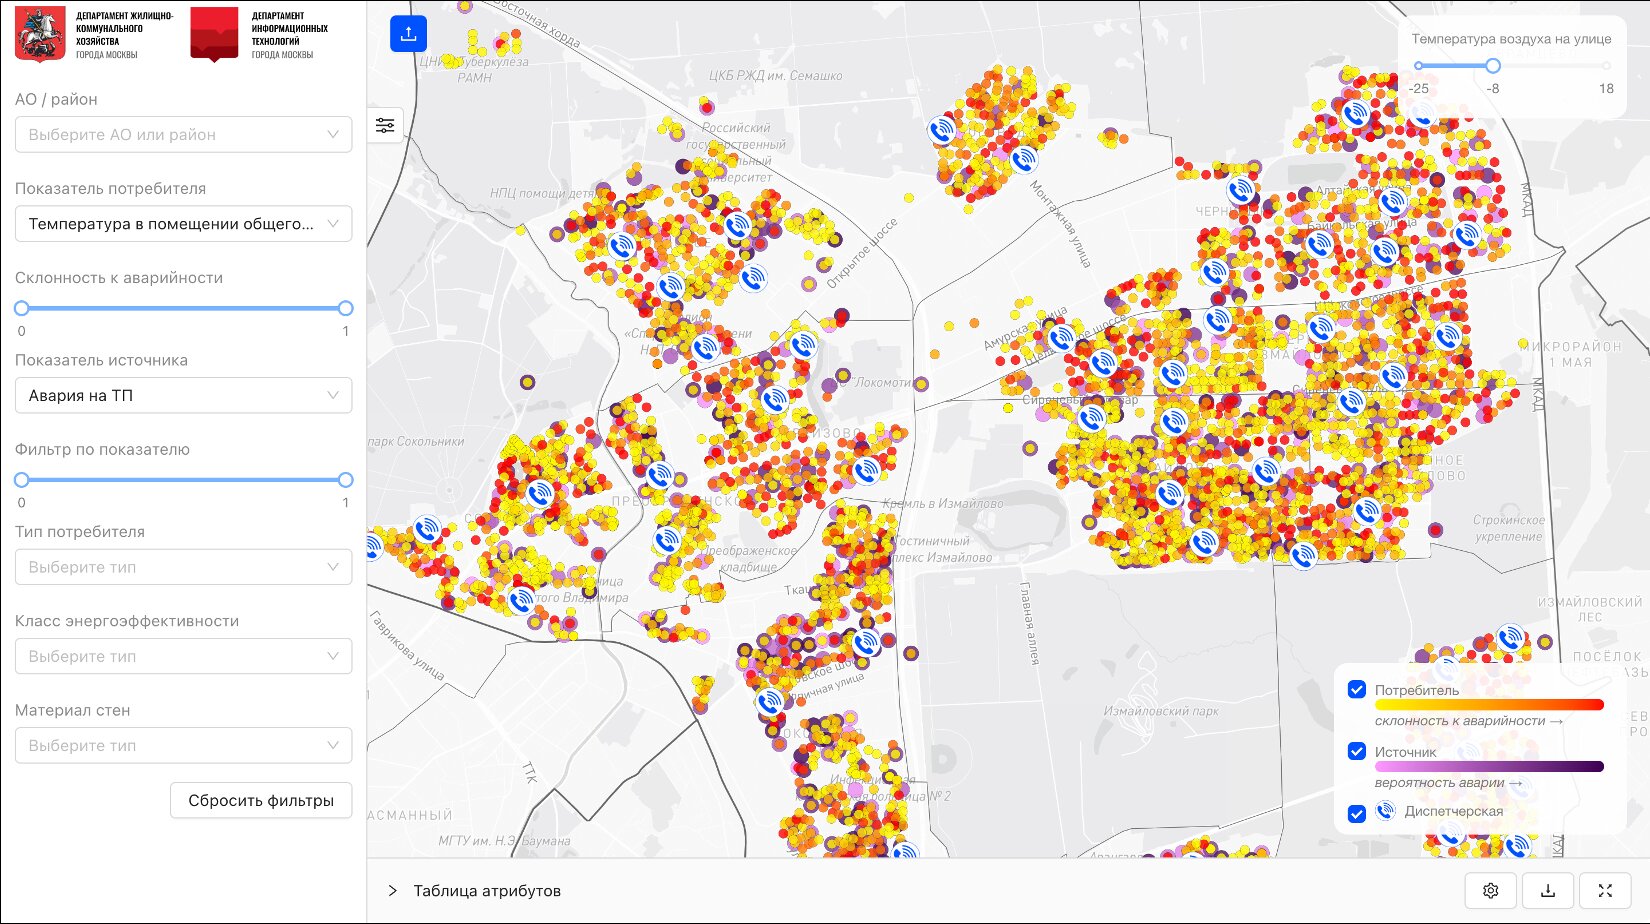
When building a model, the problem of binary classification is solved — the model determines the propensity of each residential building to different types of accidents (for example, leakage in a pipe in an apartment or entrance, lack of heating, etc.).
The result of the predicted propensity of residential buildings is displayed on the map with the possibility of using many filters.
After importing indicators of general house metering devices, the metrics on the pressure and water temperature in the pipe at the entrance to the house are compared with the standard ones. In case of deviations from the standards, the fact of an accident on a source — heating point is registered. Further, similarly to emergencies in residential buildings, an ML model is built, which determines the propensity of the heating point to an emergency.
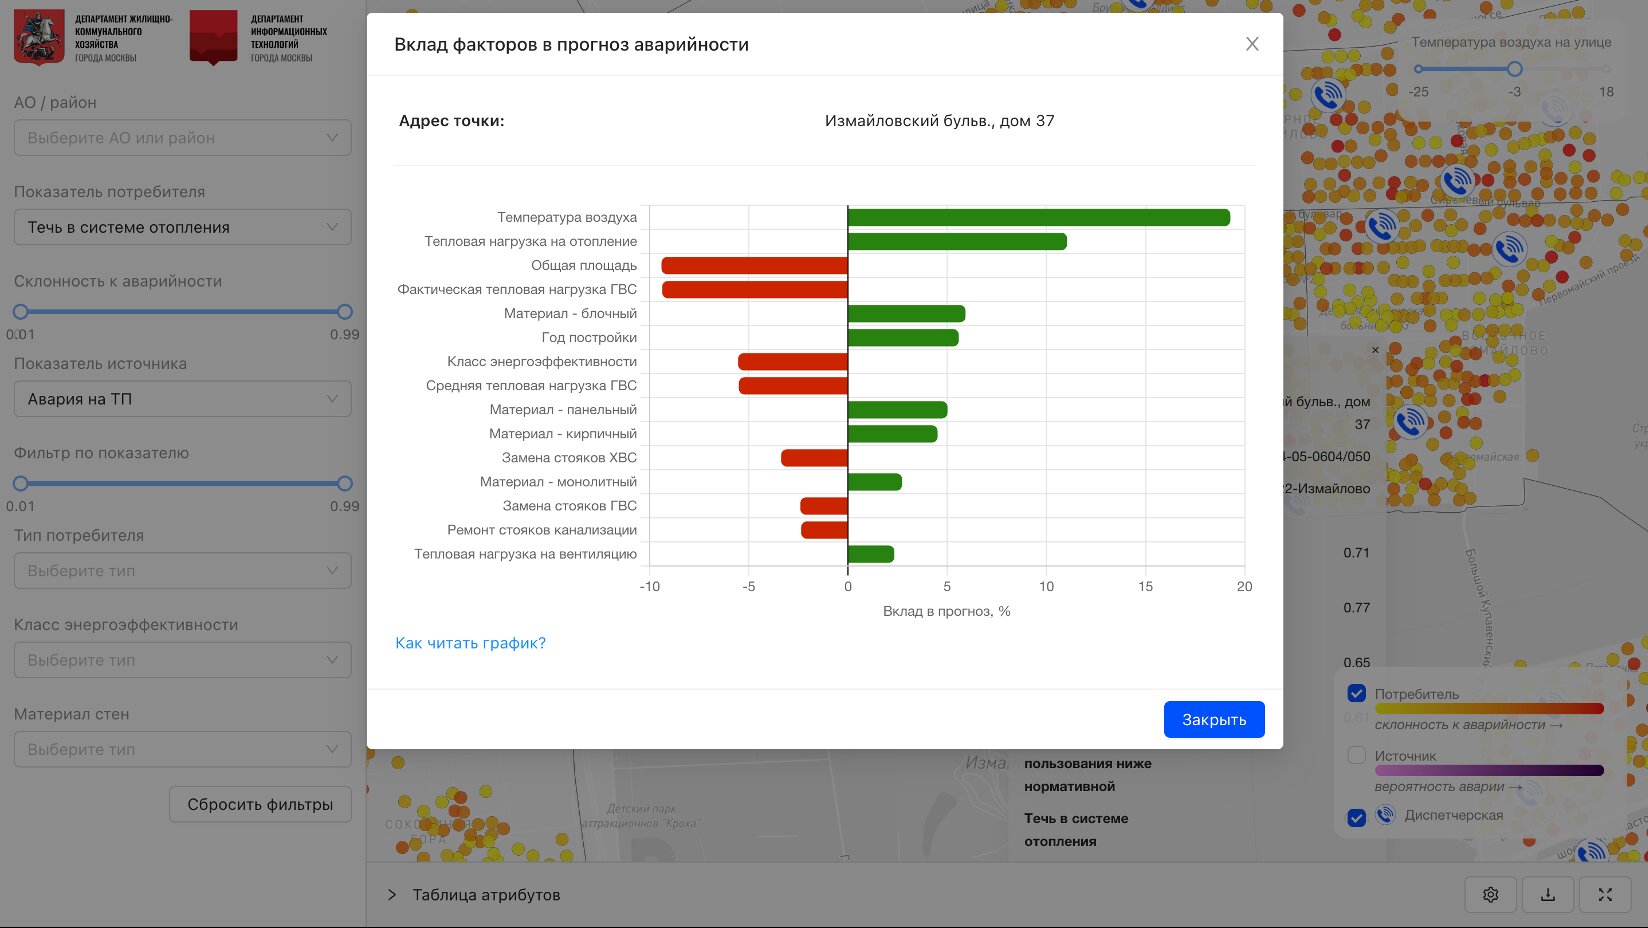
In forecasting, we use complex models that allow us to interpret the propensity for emergencies in a way that is clear to the user — the forecast can be decomposed into contribution level of all factors involved in the model and better understand which factors are most significant.
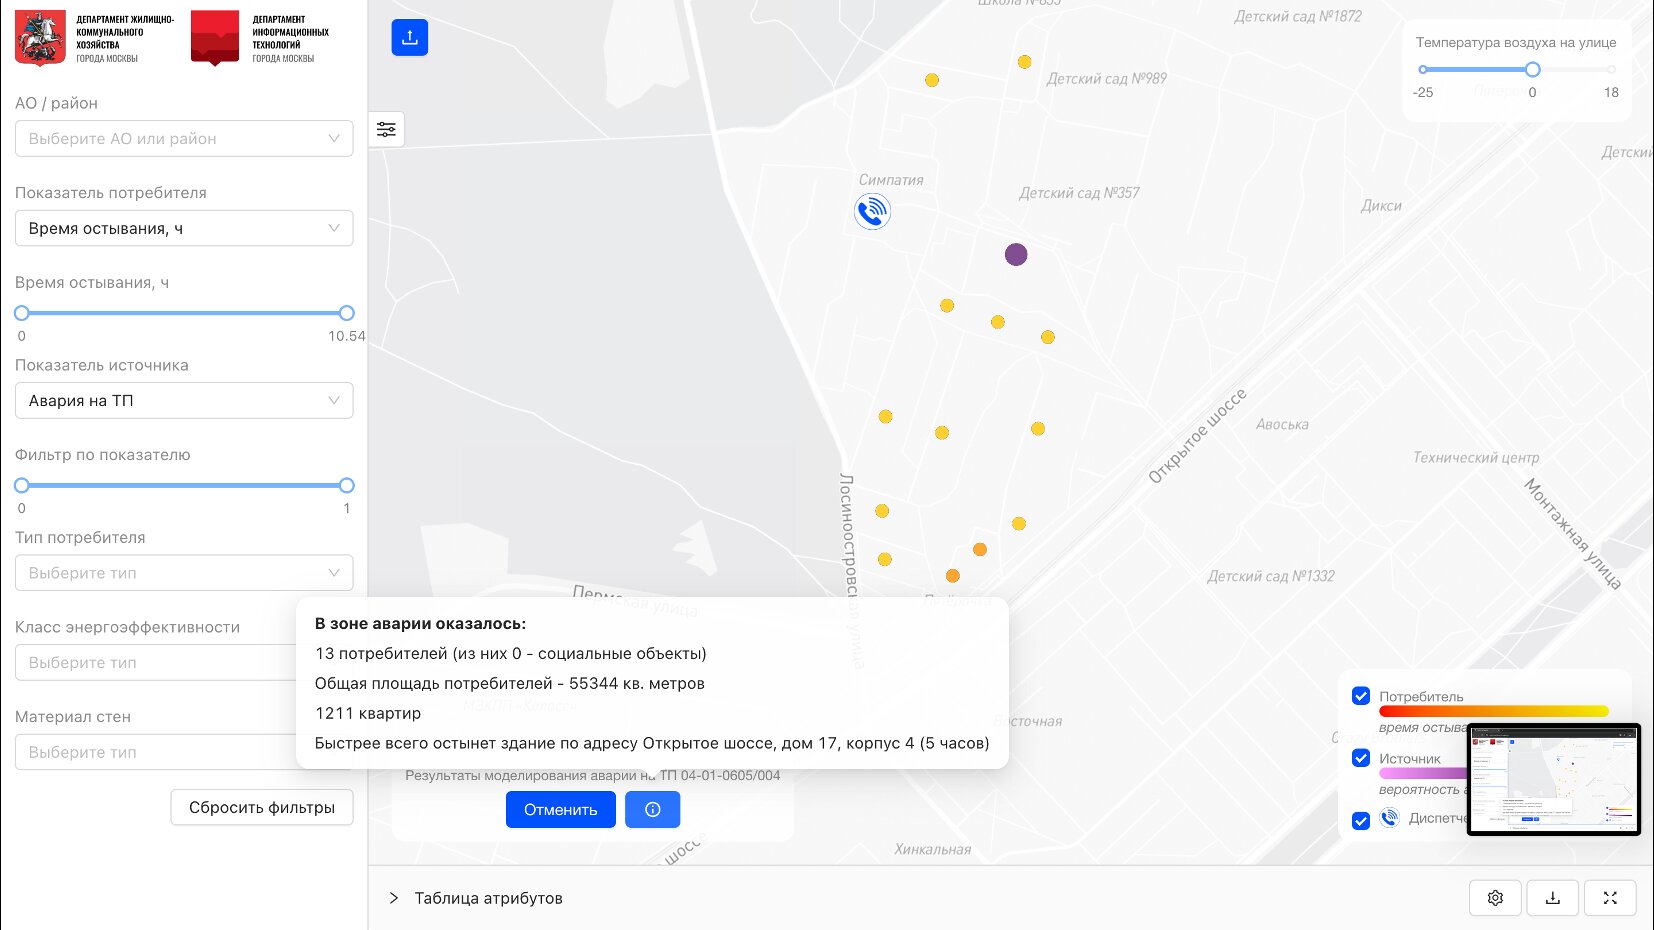
In the system, it is possible to create a simulation of an accident that has already occurred at a heating point to assess the number of consumers (residential buildings and socio-economic facilities) who find themselves in the accident zone and the rate of their cooling down, in order to form an optimal sequence of response and levelling of the emergency situation.
The functionality of the HeatEmergency system based on data analysis and machine learning methods allows you to improve control over the city heat supply system, improve understanding of patterns in the occurrence of emergency situations and prevent them.
Contact us if you are interested in a system like this